Introduction
The 3D conference is an official function of the International Society of Biomechanics
(ISB) and is considered to be the most credible and influential in the field of
Biomechanics.3D Conference of Human Movement.. from the University of Delaware, Newark DE. Dr. Richards was
assigned the task to compare as objectively as possible all the existing motion analysis
systems and present it at the Dr. James G.
Richards, Ph.D This experiment to compare the available
motion analysis system was conducted by
The experiment was conducted and the
results of this study were presented with no interference from the companies whose
products were tested. Dr. Richards selected customers sites to conduct the experiment. In
a few cases, such as with Elite and CODA, results were returned to the companies'
headquarters to determine the source for the results which were accessibly inaccurate.
."
The article published in the Proceedings were only some preliminary results and many of
these findings were incorrect. The correct, up-to-date results were presented during
the oral presentation and in the final paper by Dr. Richards. "The
Measurement of Human Motion: A Comparison of Commercially Available Systems The results of this study were presented
at the 3D Conference of Human Movement at the University of Tennessee, Chattanooga,
Tennessee. July 3rd, 1998. The title of Dr. Richards' paper was:
The clarification of results between the
preliminary, pre-Conference publication and the appropriate, up-to-date results were
particularly important for a video based system such as the APAS system. For the
APAS system, the initial results were based on data obtained from only 2 cameras which was
inappropriate for an experiment utilizing the experimental test device. The test
device had a mechanical arm which rotated 360 degrees and, therefore, obviously required a
minimum of 5 cameras in order to see each marker from at least two cameras views.
Restricting the data collection to only two cameras created some peculiar situations such
that nearly 176 degrees of motion were detected by one only camera, 112 degrees by
two cameras, and the remaining degrees were undetected by any camera. Because of the
specific conditions inherent with this test device, the experiment had to be repeated
utilizing 5 cameras. All other venders used 6 cameras. The final paper that was
presented, included 5 cameras which is the only way to be able to analyze this particular
device. All the other companies used 6 cameras and even using 6 cameras, two of the
companies could not produce reliable and valid results. However, with normal,
straightforward experimental testing of human movement, three cameras and, frequently only
two cameras, are adequate with the APAS system.
In no way has Dr. Richards supported, condoned, or contributed to this article on
our web site. Since the presentation was delivered publicly in an international
conference, the material was deemed to be in the public domain and we are pleased to have
the opportunity to present these results here.
The slides utilized here were
taken with digital camera during Dr. Richards' presentation. Therefore, the
quality of the slides were affected by the angle from where the pictures were shot
during the presentation.
Procedures
The purpose of this study
was to critically review and analyze the available commercial systems in light of their
ability to generate basic coordinate data, and to provide information regarding the
advantages or disadvantages of their unique characteristics." "
This first slide
illustrates the testing device. (As noted previously, these slides were presented
by Dr. Richards and were photographed from the audience. Dr. Richards' presented his
findings and has not contributed to this web site article.)
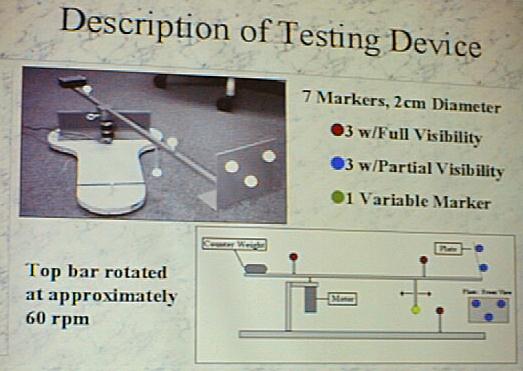
Slide 1. Description of the testing device.
(Slide was photographed during the original presentation at the 3D Conference of Human
Movement, Chattanooga Tennessee, July 3, 1998)
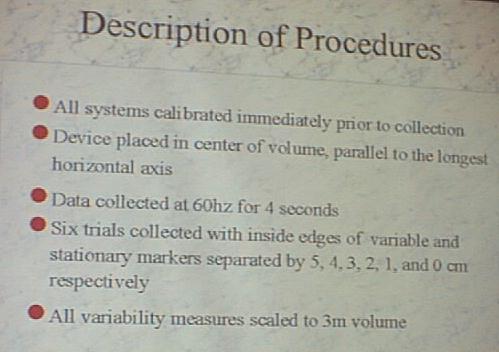
that systematically
moved markers within the measurement system's calibrated space in order to acquire
approximate measures of system accuracy and efficiency. This setup required a
minimum of 5 cameras situated at particular angles in order to see each marker with at
least 2 cameras. However, in some cases, the resultant video provided views which, for a
few frames, some markers could be seen from only one camera. Although the other
systems utilized six cameras, the APAS system utilized only five cameras. In spite of this
difference, the APAS was able to interpolate the points and yielded excellent results.device a utilized The tests
Slide 2 illustrates an original
presentation slide which described the testing procedures.
Slide 2. Description of Procedures. (Slide was photographed in the original presentation)
The systems that were reviewed
included the:
- Ariel system
- Motion Analysis HiRes system
- Peak Performance's Motus system
- Qualisys ProReflex system
- Vicon's 370 system
The Ariel System used 5 Cameras while all others
used 6 cameras.
The Elite and CODA Systems were unable to produce
reliable results, in most cases, and, therefore, were not included in this report.
Analysis of Results
,
which can be seen in other pictures, supported seven markers. Two markers were place
50 cm apart on top of a rigid aluminum bar that rotated in the horizontal plane at a rate
of approximately 60 rpm. Three markers were placed in a triangular pattern on a
plate mounted vertically at the end of the bar. The plate was perpendicular to the
bar and the markers were placed on the outside surface so that they were only visible to
the subset of cameras as the bar rotated. A sixth marker was mounted to the base of
the device on a 3-cm rigid post. The final marker was mounted to a post on the
bottom of the rotating bar. The post placed this marker at the same height as the
stationary base-mounted marker. The position of the marker below the bar was adjustable
along the length of the bar so that the minimum distance between the stationary marker and
the orbiting adjustable marker could be controlled.testing device The
Deviations from known distances between
fixed markers and deviations from known angles were determined for each of the systems
measured.
Slide 3
illustrates the original slide from the presentation at the 3D conference, describing the
various variables utilized in the study.
Slide 3. Overview of Variables
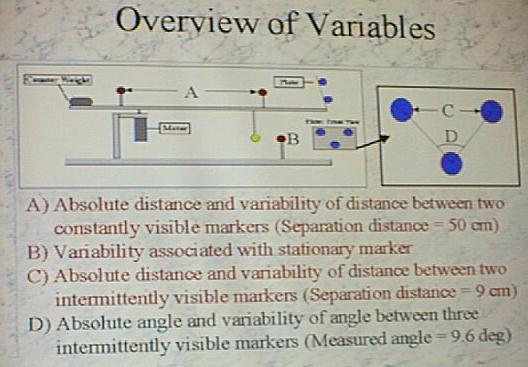
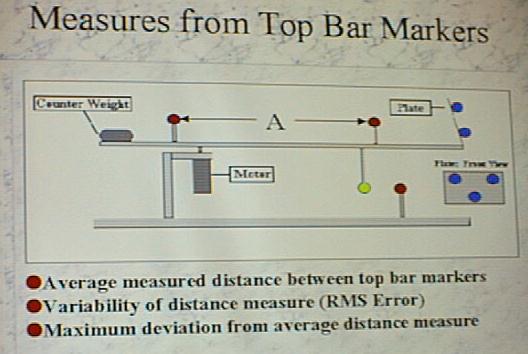
Specific measures derived from the seven
markers were as follows:
1. The measured distance between the two
markers on the top of the rigid bar was calculated for each frame of the trials.
Measured distances were averaged within each trial and subtracted from the known distance
of 50.00 cm to produce an average absolute error associated with each of the
systems. Noise associated with this measure was determined by taking the RMS of the
difference between the average measured distance and the measured distance in each frame
of the data. Slide 4 was photographed in the original presentation and illustrates
these measurement parameters.
Slide 4.. Measures from Top Bar Markers
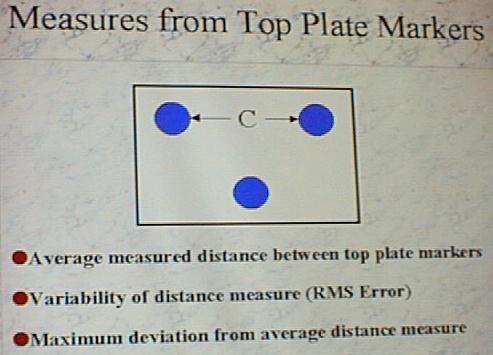
2. The measured distance between the two markers on
the top to the plate was calculated for each frame of the trials and compared to the known
distance of 9.00 cm to produce an average absolute error associated with each of the
systems. The maximum absolute error associated with the distance calculation in each
trial was also recorded. Noise associated with this measure for each trial was
determined by calculating the RMS. Slide 5 was taken at the original presentation
and illustrates these measurements.
Slide 5. Measures from Top Plate Markers
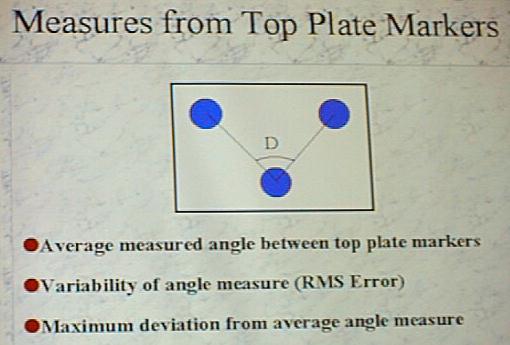
3. The three markers on the plate were used to define
an angle with the bottom plate marker serving as the vertex of the angle. The angle formed
by the three markers on the plate was calculated for each frame of the trials. Measured
angles were averaged within each trial and subtracted from the known angle of 95.80
degrees to produce an average absolute error associated with each of the systems. In
addition, the maximum absolute error associated with the angle calculation in each trial
was recorded. Variability associated with this measure for each trial was determined by
taking the RMS of the difference between the average measured angle and the measured angle
in each frame of the data. Slide 6 was photographed at the original presentation and shows
the angle.
Slide 6. Measures from Top Plate Markers.
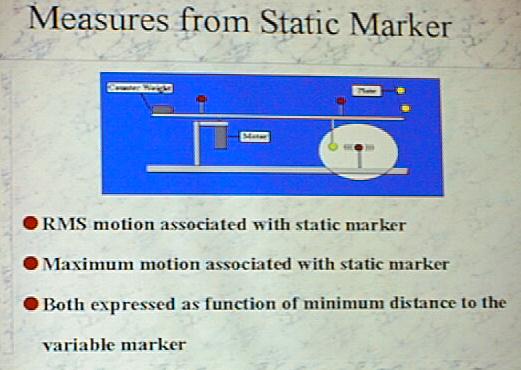
4. The variability associated with the stationary
marker measurement was determined by calculating the RMS of the difference between the
average stationary position and the measured stationary marker position in each frame of
the data. Slide 7 illustrates the original slide photographed at the presentation and
shows the measures from the static marker.
Slide 7. Measures from Static Marker.
Since 7-8-98

Visitor Number
|