|
|
9 |
50 |
96 |
0 cm |
2 cm |
|
Performance |
|
|
cm |
cm |
Deg |
Stationary |
Stationary |
Total |
Price Ratio |
|
Price $ |
test |
Test |
Test |
Test |
Test |
Score |
per $1000 |
| Ariel |
10,000 |
19 |
4 |
19 |
20 |
11 |
73 |
7.30 |
| Motion |
150,000 |
9 |
10 |
14 |
17 |
14 |
64 |
0.43 |
| Peak *** |
125,000 |
9 |
8 |
9 |
7 |
3 |
36 |
0.29 |
| Qualisys |
75,000 |
8 |
9 |
4 |
8 |
19 |
48 |
0.64 |
| Vicon *** |
250,000 |
15 |
13 |
14 |
8 |
13 |
63 |
0.25 |
Table 6. Summary of results
Table 6
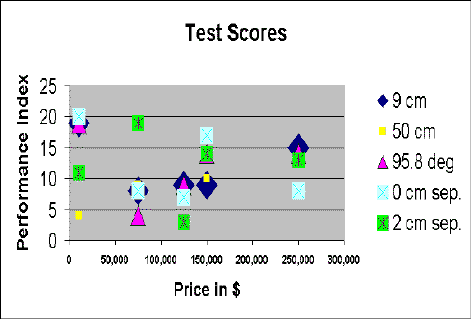
summarizes all of the test results. The APAS system scored the highest with 73
points, which exceeds the closes competitor by more than 10 points.
When considering the price
of the system, the value is more than evident. The complete APAS, including all of
the hardware and software, costs only $10,000 while the other ranked equipment range in
price from $75,000 to $300,000 or more.
Table 6 illustrates that
although the APAS cost is only $10,000 it out performed all the other companies on the
various tests. The question is how it is possible?? The answer is that the Ariel Company
does not spend money on shows, advertisements, commissions, or other marketing and
sale expenses. We do not have expensive brochures and none of us wears three piece
suits. We spend that money on continuous software and hardware
developments. These product developments and cost reductions are passed to the
customer, thus, costing you less for a better product. In other words, for $10,000 you get
the best product for the lowest price.
better than any other system.
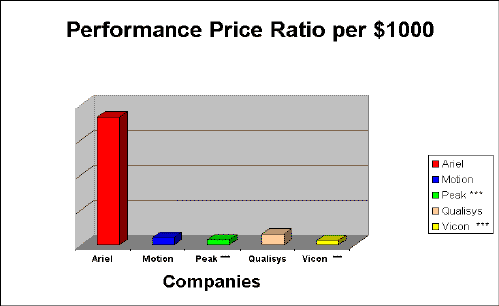
When considering the Price
Ratio per $1000.00, the APAS scored 7.30 which is more than 10 times
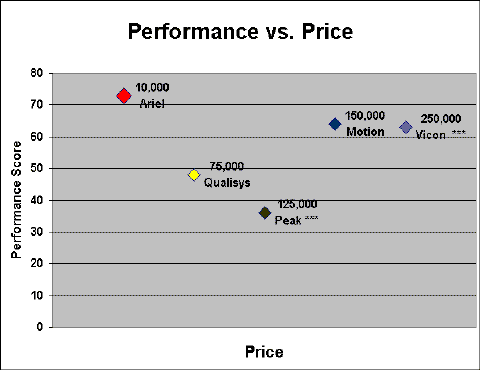
Figure 1 illustrate the scatter diagram
of the various test and plotted of price versus performance.
Performance vs. Price

Figure 1. Performance vs.
Price
It is clear to all
objective observers that the APAS outperformed all the other companies. Not only did
the APAS score the highest, in the majority of the test categories, but in all cases this
feat was accomplished at the lowest price.
Figure 2 illustrates the
Performance Price Ratio per $1000.00. Since the APAS costs only $10,000.00,
there is no sensible alternative. Since the APAS demonstrated performance levels
which exceeded those of all the other companies by substantial margins, the question
remains why any rational consumer would purchase equipment other than the Ariel
Performance Analysis System.
The Most Bang for the Buck

Figure 2. Performance vs. Price. It is
clear that the APAS delivers the most for any price.
It is clear beyond doubt that the APAS outperformed all the other companies. Not only the
APAS scored the highest performance, but in all cases, at the lowest price.

Figure 3. Performance Price Ratio per $1000
Figure
3 illustrates the Performance Price Ratio per $1000. Since the APAS costs only
$10,000.00, ($5000 for software only) there is no reasonable nor credible
alternative. If you add the two high speed cameras (120hz) to the formula, the
performance bar will exceed the size of the page... The APAS performance exceeded all the
other companies by such a margin that it is questionable why any serious investigator
would purchase any other system. Some individuals may think that the other marker
systems are faster in collecting data. However, with the introduction of the new
"Tracker" system which optimizes the automatic digitizing capability of the
APAS, the same statement is equally true for the APAS.
To summarize the entire
study, it was revealed in this independent study by the highest authoritative
research-affiliated organization and presented at the 3D Conference of Human Movement in
Chattanooga, Tennessee on July 3, 1998 that the APAS system exceeded all other system in
analyzing valid and reliable data for Human and biological movement. link here to see what they wrote.But the bottom line is what our customers think about us.
In a recent messages to the Biomch-L list,
Also
check our customers comments here
Why Should You
Select the Ariel Performance Analysis System for Your Movement Quantification Needs? |