Journal of Medical Systems, Vol. 20, No. 6, 1996
of Kinematic Recording InstrumentsA
Comparison
Richard H. Eckhouse,',* M. Ann
Penny,2 and Ruth A. Maulucci3[Back to Home Page]
Kinematics, the study of motion, is employed in numerous
biomechanics and human performance investigations. The types of instrumentation used in
these studies vary at fundamental technical levels, making it difficult to relate results
from studies carried out at different laboratories using different instrumentation. A
project was designed to compare two commonly used types of kinematic recording techniques,
i.e., the 6 df electromagnetic tracker system and the video motion analysis system. A
four-level testing and comparison method was conducted involving static and dynamic
inanimate objects, as well as human subjects under static and dynamic conditions. It was
demonstrated that for rigid body inanimate objects the two systems produce nearly
identical values under stationary conditions and are comparable under moving conditions.
The systems show only trivial discrepancies in static human body measurements, and perform
in qualitatively similar ways on human motion.
KEY WORDS:
Kinematics; electromagnetic tracker; video motion analyzer; reaching.
Kinematics, the study of motion, is employed in numerous
biomechanics and human performance investigations. The types of instrumentation used in
these studies abound, and vary considerably at fundamental technical levels. An early
review of recording systems for biomechanical analysis is found in Ayoub.0) A later
comparative analysis of kinematic measurement systems given in Tyson and Das.(2) Such a
variety of devices makes comparisons among studies conducted at different laboratories
with different instrumentation difficult, and limits the usefulness of the results.
INTRODUCTION
An important and much
explored area of biomechanics is guided limb motion or reaching for a target in the
workspace of the arm. A brief survey of the literature revealed that there are two
categories of instrumentation that are very common choices for reaching studies, these
being electromagnetic tracking and video motion
To whom correspondence should be addressed.
2Computerized Biomechanical Analysis, Trabuco Canyon, California. 3MOCO, Inc., Scituate,
Massachusetts.
'Mathematics
and Computer Science Department, University of Massachusetts-Boston, 100 Morrissey
Boulevard, Boston, Massachusetts 02125-3393.
]Go to Top of Document[
440
Eckhouse,
Penny, and Maulucci
analysis.
The question arises as to whether the results of studies employing these different types
of devices are compatible. Thus, a comparison of the performance of the two types of
systems should prove to be of general value.
The first category of systems consists of electromagnetic
trackers.(3-7) These provide the 6 df of a moving sensor relative to a fixed source,
employing technology that uses low frequency magnetic fields to make these measurements.
These systems record angular information directly, with sensors that are attached to the
skin surface. There can be slippage of the sensors, particularly in the twist motions,
problems can arise due to interference from metal in the environment, and there can be
delays due to filtering.
The second category, video motion analyzers, is made up of two- and
threedimensional human performance systems.(8,9) Body segment points are located with
retroreflective spherical markers attached by double-sided tape, and the systems
automatically track these markers through successive frames, assuming adequate background
contrast. Each camera sees a marker in two dimensions; a marker must be in the field of
view of at least two cameras simultaneously in order for its threedimensional location to
be calculated. In some systems, if a marker becomes occluded, the system automatically
supplies the missing point by interpolation. Typically, system resolution and accuracy are
high. Software for data capture, threedimensional calibration, computation of the
three-dimensional coordinates of the target markers, interactive graphics for plots and
stick figures, statistical routines, and signal processing is often available, and data
reduction is rapid. Some of these systems demand a controlled environment, since the
system requires multiple electrical outlets, a room with a matte finish, heavily draped
windows, and fluorescent light. An optional feature in some of the systems is that it is
possible to record without markers and then manually digitize each frame; the trade-off,
however, is that the operator must locate joint centers. As a compromise, some systems
allow points of interest on the subject to be tracked semi-automatically without markers,
requiring that the operator initially identify the desired points; the system then
predicts the location of these points in subsequent frames.
There are many examples of reaching studies that used electromagnetic
or video systems. The use of electromagnetic monitoring to quantify eye-head-hand
coordination during reaching tasks has been reported.(10) Free(11) and constrained(12) arm
and leg reaching movements were examined using a four-receiver electromagnetic device. A
computerized system centered around a 6 df electromagnetic device was build by Eckhouse et
al.(13) to facilitate reaching in preschool children with cerebral palsy by modifying the
trajectory of the arm. A magnetic kinesiograph was used to compare slow arm movement
trajectories in patients with Parkinson's disease to those of normal subjects.(14) An
electromagnetic transmitter was used to examine whether the straight line paths of
two-joint planar reaching movements reflect constraints associated with perception or
movement production.(15) High-speed film was digitized to discuss the effects of load and
variation on the autoregressive integrated moving average model for muscle signals.(16)
Three high-speed cameras were used to identify the curvature-speed relationship in the
reaching movements of infants.(17)
]Go to Top of Document[
441
Instrument Comparison A project was
designed to compare these two commonly used types of kinematic recording techniques, i.e.,
the 6 df electromagnetic device and the video motion analysis device, in guided limb
motion tasks. The specific member of the former group that was selected was the Ascension
Flock of Birds (FOB), and the Ariel Performance Analysis System (APAS) was chosen from the
latter group. The goal was to determine how close these two very different types of
devices operate, and whether the results obtained from one system could be compared with
the results from the other. There are several possible sources of measurement errors or
differences for the two systems, particularly in applications involving human subjects.
They could be caused by system setup, sampling rate, resolution, accuracy, receiver and
marker attachment to the body, and receivers and markers moving with the skin surface.
Digitizing errors and magnetic field corruption contribute additional complicating
factors. To isolate the possible different causes, a four-level testing and comparison
method was conducted involving static and dynamic inanimate objects, as well as human
subjects under static and dynamic conditions.
this discussion, trajectory refers to a time
series of points that define the position of a translational coordinate or angle
throughout its interval of motion. A functional reach is a task oriented limb movement,
such as reaching for a target. With regard to human subjects, x is the medial/lateral, y
is the anterior/posterior, and z is the superior/inferior direction.
Throughout
is a real-time, electromagnetic mechanism that
provides the location (x, y, z) and orientation (a-azimuth, e-elevation, r-roll), i.e., 6
df, of moving receivers relative to a fixed transmitter. Output is in the form of time
series signals that uniquely determine the location and orientation of the receivers
relative to the transmitter. The receiver is a small cube of about 2.5 cm that weighs less
than 0.03 kg. The transmitter assembly is a larger cube about 9.5 cm weighing about 1.8
kg. The system provides hemispherical measurement within a 1 m radius. System resolution
is 0.1 deg rotational and 0.08 cm translational; accuracy is approximately 0.5 deg for
rotations and 0.25 cm for translations. Sampling rate is 100 Hz per receiver. The output
is connected via a high speed asynchronous serial RS-485 communications adapter to a
microcomputer for immediate processing. Up to four FOB receivers were used simultaneously
in this project, each receiver attached to an individual object or body segment, allowing
the recording of the three translational and the three rotational coordinates of that
object or segment. Thus, the exact location and orientation of the object or segment was
specified throughout the interval of motion. FOB The
The APAS is a three-dimensional video motion analysis system. One or
multiple cameras can be used, markers are optional, and automatic or manual digitizing is
supported. The image sequences are stored, in picture form, on a computer for
]Go
to Top of Document[
442
Eckhouse,
Penny, and Maulucci
subsequent
processing. The system permits frame grabbing, frame retrieval, data compression,
smoothing and filtering options, and zooming. Viewing and graphing modules for the
digitized activity, measured or computed, are available. Two variable shutter cameras were
used in this project, each operating at 60 frames per sec. Several types of reflective
markers were used to assist in identifying the points of interest: a finger cot with
reflective tape, large and small reflective balls, and a splint with a small reflective
ball attached to each end. Selected points were digitized in each frame, producing the Y, y, and z translation trajectories, i.e., the location of each coordinate
over time, of the points.
could be
synchronized and used concurrently. Each trial proceeded as follows. A large light
emitting diode (LED) display was placed in the viewing field of the two APAS cameras. The
two cameras were started. The trial number was presented to the cameras manually by
placing a clipboard containing the written number in front of the cameras for a few
seconds. By means of a keystroke, three events occurred simultaneously, namely, a tone was
emitted, the LED display changed, and FOB data collection was initiated. The data were
collected for 6 sec. At that instance, the LED display changed again and the FOB stopped
automatically. The cameras were turned off manually. Thus, the two APAS frames in which
the LED changed corresponded to the initial and final data points of the FOB. This allowed
the signal points of one system to be matched in time with the signal points of the other
system, and in addition synchronized the two APAS cameras.
FOB and APAS A method was devised so that the
A formal protocol was developed to permit comparison of the two
systems. System performance was examined at four levels, each increasing the difficulty of
obtaining system compatibility. The first level, termed static inanimate, was to determine
the x, y, and z translational distances between two fixed points, the fixed flexion angle
formed by a goniometer, and the fixed twist angle displacement made by a goniometer. In
the second level, dynamic inanimate, trajectories were obtained for the three translation
signals of a randomly moving point, the randomly changing flexion angle formed by two
rods, and the randomly changing twist angle produced by a rod. For the third level, static
animate, a human subject held his or her arm in various fixed positions intermediate to a
functional reach; the three translational distances between selected body landmarks, joint
flexion angles, and angles formed by body segments and the coordinate axes were obtained.
At the fourth level, dynamic animate, the human subject made simple functional reaches;
the x, y, and z translation trajectories of selected body landmarks, joint flexion and
twist angle trajectories, and trajectories of angles formed by body segments and the
coordinate axes were acquired.
443
Instrument Comparison Levels III and IV were conducted with human subjects. No attempt was
made to control for age, gender, handedness, stature, or weight, since the objective was
simply to compare data simultaneously acquired by the FOB and the APAS. Informed consent
was obtained from each subject prior to the start of any testing.
II. Dynamic Inanimate
Level IA
Level I.A was to use the FOB and the
APAS to calculate the Y, y, and z translational distances between two
fixed points. An APAS large reflective ban was attached to the top of each of two FOB
receivers, and the two marker/receiver combinations were set at oblique x, y, and z
distances. The x, y, and z distances were measured three times in short succession with a
steel measuring tape, calculated for each sample acquired by the FOB during the 6-sec data
collection interval, and calculated for each frame acquired by the APAS during the
six-second data collection interval. Three trials were made, with the marker/receiver
combinations placed in different locations each time.
Level LB
Level I.B was to calculate the fixed
flexion angle formed by a plastic full-circle universal goniometer. An APAS large
reflective ball was attached to the top of each of two FOB receivers. One of these was
placed at each arm end of a goniometer, and one APAS large reflective ball was placed at
the vertex of the goniometer. The goniometer was set to an arbitrary angle. The goniometer
angle was read three times, and was calculated for each FOB sample and each APAS frame
during the 6-sec collection interval. Fourteen trials were made, with the goniometer at
different angles and in different states of rotation and tilt relative to the APAS
cameras.
Level I.C
splint that had a small reflective ball attached to
each end, with the receiver wire perpendicular to the splint. The edge side of the splint
was placed along one arm of a goniometer, with the center of the edge at the vertex of the
goniometer. Note that in this configuration, if the splint combination were attached to a
segrnent perpendicular to the goniometer at its vertex, the flexion angle of the
goniometer arm would be equivalent to the twist motion of the segment. During the 6-sec
data collection interval, the goniometer was set in succession to two different
arbitrarily APAS Level I.C was to calculate the fixed
twist angle displacement made by a goniometer. An FOB receiver was attached to the center
of the flat side of an
]Go
to Top of Document[
444
Eckhouse,
Penny, and Maulucci
frame in which they occurred, i.e., for approximately 3 sec each. The means of the two
angle values were used to calculate the mean twist angle displacement. Eight trials were
made, with the goniometer skewed differently with respect to the APAS cameras. APAS
selected
angles. The two angles were read three times each, and calculated for each FOB sample and
Level IIA was to obtain the trajectories for the x, y, and z
translation signals of a randomly moving point. An APAS large reflective ball was attached
to the top of an FOB receiver, and the marker/receiver combination attached to the end of
a long rod. The rod was manually translated randomly in three dimensions during the data
collection interval. The x, y, and z trajectories of the marker/receiver object were
calculated from the FOB and APAS data, and then graphed. Four trials were made, with
different random motions and speeds of the rod. Level II.A
Level II.B was to obtain the trajectory of a randomly changing
flexion angle formed by two rods. An APAS large reflective marker was attached to the top
of each of two FOB receivers. One marker/receiver combination was put at each end of two
joined rods, and an APAS large reflective marker was put at the vertex of the joined rods.
During the data collection interval, the flexion angle of the rods was changed while the
rods were translated, all with continuous random motion made manually. The flexion angle
trajectory of the rods was calculated from the FOB and APAS data, and graphed. Three
trials were made, with different translating and angle motions of the rods. Level II.B
data, and graphed. Three trials were made,
with different translation and angular motions of the rod. APAS Level II.C was to obtain the trajectory of a randomly changing
twist angle of a rod. An FOB receiver was attached to the center of an APAS splint with a
small reflective ball at each end. The splint was put on the rod as a crosspiece. During
the data collection interval, the twist angle of the rod was changed while the rod was
translated, all manually with continuous random motion. The twist angle trajectory of the
rod was calculated from the FOB and Level II.C
Level III consisted of a human subject holding his or her arm at
the initial, intermediate, and final positions of a simple three-dimensional functional
reach. Targets of various shapes and in various locations within the workspace of the arm Level III
]Go to Top of Document[
445
Instrument Comparison from a seated
position were used. All reaches were made at natural speeds, as established by the
subject.
The basic reach consisted of a decision to access a target in the
workspace, followed by visually locating the target, and then using visually guided motion
to bring the arm naturally to a successful access of the target. During the reach, the
torso remained stationary and against the chair. The proximal end of the clavicle was
fixed, meaning that it did not translate. Clavicle, shoulder, elbow, and wrist motion was
allowed. Accuracy was important, reaction time was not, and movement time was whatever was
natural for the individual. The initial position was with the upper arm perpendicular to
the ground, the elbow at 90 degrees, and the forearm midway between pronation and
supination. The final position was with the pad of the middle finger on the target and the
palm facing away from or toward the subject. An intermediate position was any position
between the initial and final positions that occurred naturally during the reach. The
forward distance of all targets from the shoulder was the same and was determined as
follows. It was the distance at which the shoulder had to be placed from a point that was
16 cm above and laterally aligned with the shoulder to induce full arm extension to touch
the point.
angles. Figure 1
illustrates the subject instrumentation, complete with receivers and markers. Six subjects
were used. Three targets in different locations and requiring different final positions
were used. For each target, the subject assumed the three positions for six seconds each. dial/lateral rotation twist The subject was instrumented with four FOB receivers, one on each
segment of the arm, i.e., the hand, forearm, upper arm, and clavicle. The receivers were
numbered distally to proximally 1, 2, 3, and 4. It was found that the best results were
obtained by first mounting the receiver on a tongue depressor, then securing it to the
body segment with medical tape, and then placing a light net stretch-and hold first-aid
sleeve over it. The subject was simultaneously instrumented with several APAS reflective
markers, i.e., a finger cot, forearm splint, large elbow ball, upper arm splint, large
shoulder ball, and large clavicle ball. The large elbow, shoulder, and clavicle balls were
not placed on the joints, but rather served as a cue for locating the joint centers during
later digitizing. The forearm and upper arm FOB receivers and the corresponding forearm
and upper arm APAS splints were placed at the same point longitudinally on the limb
segment so as to minimize actual differences along the segment of the forearm
pronation/supination and shoulder me
The following calculations were made from both the FOB and APAS data,
using all samples or all frames of the 6-sec data collection interval. The x, y, and z
translational distances between each adjacent pair of FOB receivers was calculated. Wrist
flexion/extension, wrist radial/ulnar deviation, and elbow flexion/extension angles were
also calculated. Finally, the upper arm X-axis angle, upper arm Y-axis angle, and upper
arm Z-axis angle were calculated, these being defined relative to an inertial moving
coordinate system, with origin that was attached to and moved with the shoulder at the
acromion and axes that remained directed as and parallel to those of the FOB transmitter.
]Go to Top of Document[
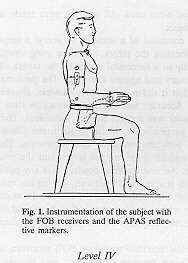
Fig. 1. Instrumentation of the subject with the FOB receivers and the APAS reflective
markers.
446
Eckhouse,
Penny, and Maulucci
Level IV
consisted of a human subject making a simple three-dimensional functional reach. The basic
reach, targets, and instrumentation were as defined for Level 111. The reach was made
during the 6-sec data collection interval. During this interval, the x, y, and z
translation trajectories of the end effector, wrist, elbow, and shoulder were obtained.
Trajectories for the wrist flexion/extension, wrist radial/ulnar deviation, forearm
pronation/supination, elbow flexion/extension, upper arm Xaxis, upper arm Y- axis, upper
arm Z-axis, and shoulder medial/lateral rotation angles were also obtained during the
6-sec interval. Graphs for all trajectories during the actual movement time, i.e., the
time from the initiation of arm movement to the touch of the target, were produced.
Eighteen targets, differing in location or final position required, were used.
Several types of analyses were performed on the data acquired with the
manual system, the FOB, and the APAS in the four-level testing. It was necessary to limit
the number of trials for incorporation into the analyses because the APAS data were
manually digitized which is an extremely time-consuming process for this type of
application. Representative trials were randomly selected from each level or sublevel.
Table I gives measurement values obtained from Level I testing for the
measuring tape or goniometer (referred to as the manual system), the FOB, and the APAS.
The x, y, and z values (centimeters) are for one arbitrarily selected trial of Level I.A.
They are calculated by taking the average of the three tape measure
]Go to Top of Document[
(Degrees) for the Manual System, the FOB, and the APAS
Angle (Degrees), and a Fixed Twist Angle Displacement
Between Two Fixed Points (Centimeters), a Fixed Flexion
I. Measurement Values of the Translational Distances Table
447
Instrument Comparison
| |
Manual System |
FOB |
APAS |
| x |
37.4 |
37.7 |
37.5 |
| y |
55.9 |
56.1 |
55.6 |
| z |
20.0 |
21.0 |
20.5 |
| Flexion Angle |
135 |
135 |
135 |
| Twist Angle |
46 |
47 |
47 |
frames. The flexion
angle values (degrees) are for a trial in Level I.B in which the goniometer was
perpendicular to the ground, but at a 45 degree angle outward with respect to the APAS
cameras. They are calculated by taking the average of the three goniometer readings, all
of the FOB samples, or all of the APAS frames. The twist angle values (degrees) are
calculations of the displacement angle for a trial in Level I.C in which the goniometer
was rotated and tilted relative to the plane of the APAS cameras. They are calculated from
the average of the three goniometer readings, all of the FOB samples, or all of the APAS
frames for each of the two composite angles. A one way analysis of variance applied to the
five values obtained with each of the three techniques revealed no differences in the
means among the manual system, the FOB, and the APAS (p > 0.05). 360 APAS ments, the
average of the 600 FOB samples, or the average of the
Figures 2, 3, and 4 afford a visual inspection of results of the Level
II testing. Trajectory graphs of the
Y,
y, and z translation signals for
one trial of Level II.A for the FOB and the APAS, respectively, are given in Fig. 2a,b.
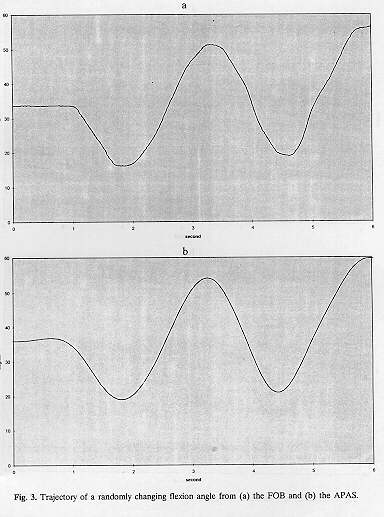
One trial of flexion angle trajectory graphs from Level II.B is given in Fig. 3a,b,
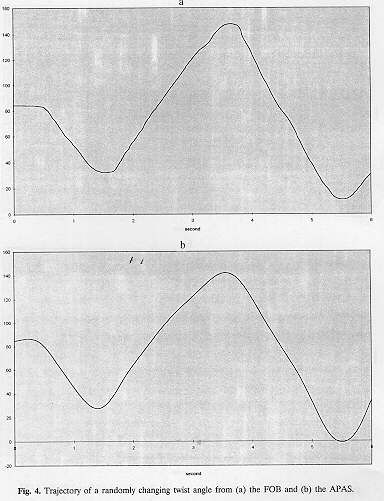
respectively, for the FOB and APAS. Graphs of the twist angle trajectory at Level II.C for
one trial are given in Fig. 4a,b for the FOB and APAS, respectively.
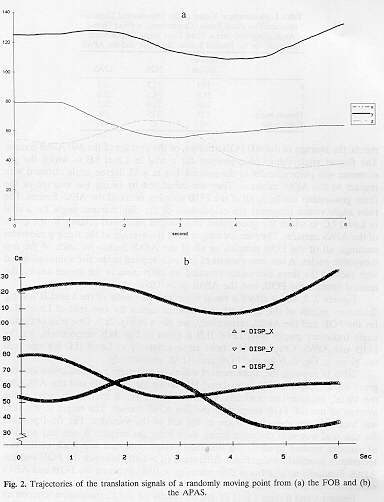
Table Il contains the measurement values (centimeters for translations
and degrees for angles) obtained from Level III testing for the FOB and the APAS for the
initial, intermediate, and final positions of one reach trial. Each value is the average
of the 600 FOB samples or the 360 APAS frames. The target in this trial was located 8 cm
above and 8 cm to the left of the shoulder. The final position for this trial was with the
palm facing away from the subject. A one way analysis of variance applied to all of the
translation values obtained with each of the two techniques revealed no significant
differences (p > 0.05) between the FOB and the APAS. Similarly, no significant
differences (p > 0.05) between the FOB and APAS were observed for the angle values.
Figures 5 and 6 show Level IV testing results for the 12 translation trajectories and the
eight angle trajectories. Graphs for one trial from one subject are shown in Fig. 5a-d
for the FOB translations and angles and the APAS translations and angles,
respectively. The target in this case was located at shoulder level and 16 cm, to the
right of the shoulder, with a final position of the palm facing toward the subject. Figure
6a,b, respectively, for translations and angles, shows this same trial as the FOB values
plotted against the APAS values during the movement time. Specifically, for each point
during the movement time of the reach, each of the 12 APAS translation values is paired
with the corresponding FOB translation value and all pairs plotted on the same graph;
similarly, for each sample, the eight APAS and corresponding FOB angles are paired and
plotted on a second graph. These graphs offer a further examination of the similarity of
the two systems, in that the closer the data points in the graphs can be fitted by a
straight line with slope 1, the more alike are the values of the two systems.
Fig. 2.
Trajectories of the translation signals of a randomly moving point from (a) the FOB and
the APAS.
]Go to Top of Document[
Instrument Comparison 447
ments, the
average of the 600 FOB samples, or the average of the 360 APAS frames. The flexion angle
values (degrees) are for a trial in Level I.B in which the goniometer was perpendicular to
the ground, but at a 45 degree angle outward with respect to the APAS cameras. They are
calculated by taking the average of the three goniometer readings, all of the FOB samples,
or all of the APAS frames. The twist angle values (degrees) are calculations of the
displacement angle for a trial in Level I.C in which the goniometer was rotated and tilted
relative to the plane of the APAS cameras. They are calculated from the average of the
three goniometer readings, all of the FOB samples, or all of the APAS frames for each of
the two composite angles. A one way analysis of variance applied to the five values
obtained with each of the three techniques revealed no differences in the means among the
manual system, the FOB, and the APAS (p > 0.05).
Figures 2, 3, and 4 afford a visual inspection of results of the Level
II testing. Trajectory graphs of the x, y, and z translation signals for one trial of
Level ILA for the FOB and the APAS, respectively, are given in Fig. 2a,b. One trial of
fleidon angle trajectory graphs from Level ILB is given in Fig. 3a,b, respectively, for
the FOB and APAS. Graphs of the twist angle trajectory at Level II.C for one trial are
given in Fig. 4a,b for the FOB and APAS, respectively.
for
the initial, intermediate, and final positions of one reach trial. Each value is the
average of the 600 FOB samples or the 360 APAS frames. The target in this trial was
located 8 cm above and 8 cm to the left of the shoulder. The final position for this trial
was with the palm facing away from the subject. A one way analysis of variance applied to
all of the translation values obtained with each of the two techniques revealed no
significant differences (p > 0.05) between the FOB and the APAS. Similarly, no
significant differences (p > 0.05) between the FOB and APAS were observed for the angle
values.
APAS Table II contains the measurement values (centimeters for translations
and degrees for angles) obtained from Level III testing for the FOB and the
translations
and angles, respectively. The target in this case was located at shoulder level and 16 cm
to the right of the shoulder, with a final position of the pahn facing toward the subject.
Figure 6a,b, respectively, for translations and angles, shows this same trial as the FOB
values plotted against the APAS values during the movement time. Specifically, for each
point during the movement time of the reach, each of the 12
and the APAS Figures 5 and 6 show Level IV testing results for the 12 translation
trajectories and the eight angle trajectories. Graphs for one trial from one subject are
shown in Fig. 5a-d for the FOB translations and angles
Fig. 3. Trajectory of a randomly
changing flexion angle from (a) the FOB and (b) the APAS.
Table III is a chart of a
statistical analysis of the Level IV results over all six subjects for the target just
defined. Six subsets of the set of 20 translation and angle trajectories were selected,
these being the end effector translation; elbow translation; all four joint translations
taken together; elbow flexion/extension angle; upper arm X, Y, and Z axis angles; and all
eight angles taken together. For each
subset, the signed difference
between corresponding FOB and APAS values for each sample during the movement time of the
reach trial for every subject was calculated. Descriptive statistics of mean, median, and
standard deviation were applied to these differences, for each subset. A mean close to 0
implies that there is no bias between the two systems in that it indicates that neither
system is consistently operating at a higher or lower range than the other, although it
does not necessarily signify that
Instrument Comparison 451
]Go to Top of Document[
the differences between the system values are small. Finally, a
reliability coefficient(18,19) was calculated for each subset, using the actual
measurement values given by the two systems. This coefficient, ranging from
0.0 to 1.0, is a measure of the capability of
the FOB and APAS to produce the same value when operating under uniform conditions, with 1.0
indicating perfect reliability.
DISCUSSION
The FOB and
the APAS have been compared under different conditions of operation. In Level I, it was possible to evaluate these two instruments
against traditional devices used in conventional anthropometry, namely, the steel
measuring tape and the plastic goniometer, thus allowing the results to be considered with
respect to commonly accepted actual values. In general, however, since there are no
standard kinematic instruments with which to validate the results, this study investigates
how close the performances of the FOB and APAS are to each other, rather than how close either is to the true physical
measurement.
Level
I, the easiest level in which to obtain system
compatibility since it deals with rigid bodies and no motion, shows the FOB and APAS to be operating close to each other and close to the actual physical
measurements. Level II becomes more difficult with the introduction of motion. However, the systems are still operating with visually comparable
results for both translation and angle trajectories. Level III introduces to the systems
the complexities in dealing with the human body. Nonetheless, the FOB and the APAS still show no significant incompatibilities in this static case. This is
particularly impressive since due to the inherent operation of the two systems, they do not always calculate from the same quantities
when used with a human subject. For example, a tilt in the receiver caused by the slants
and contours of the body segment to which it is attached will
influence the angle
and Degrees for Angles) for Functional Reaches From Six Subjects
Table III. Statistical Analysis of the FOB and APAS Differences
(Centimeters for Translations
455
Instrument Comparison
End effector translation
1.22
0.88 1.94 0.997
Elbow translation
-0.07
-0.03 1.48 0.999
All joint translations
0.12
0.20 2.12 0.998
Elbow flexion/extension angle
4.17
6.11 5.82 0.954
Upper arm X-, Y-, Z-axis angles
2.67
2.47 4.28 0.991
All joint angles
4.33
3.29 15.49 0.980
Mean Median SD Reliability
measured by
the FOB. Furthermore, the anatomical angles do not correspond to the Euler angles that are
directly collected by the FOB, and must be calculated, often from more than one receiver;
slight misalignments, can impact on these calculations. With regard to the APAS, misses in
the location of the joint center on the limb segments, with either manual or automatic
digitizing, will influence the angle measurements. Finally, for the FOB, the joint angles
are calculated from angle values, whereas for the APAS they are calculated from positional
values of the vertex and sides of the angle; thus, numerical discrepancies might be
expected to arise from the mathematical calculations.
At Level IV, the full array of complicating factors inherent in the
human body are present. Issues such as skin rotations, muscle activity, and tissue masses
all have the potential to contribute errors in the acquired data and challenges to system
compatibility. From the graphs, it can be observed that the shapes and displacements of
corresponding signals are quite similar. The reliability coefficients indicate that
overall the systems produce close results for both translation and angle trajectories.
to attain the same measurement. With this exception, however, any
differences are due to the basic operation of the systems, and not to discrepancies in
signal processing algorithms or routines. FOB and
APAS data It is important to note that the data were taken from the systems at
the most rudimentary level of each system, prior to the application of any system analysis
software, and then processed using the same analysis software in both cases. In
particular, the FOB data were taken as the x, y, z locations and the a, e, r angles of the
receivers, and the APAS data were taken as the x, y, and z locations of the end effector,
wrist, elbow, shoulder, and stenoclavicular joint, and of the two reflective bans on the
forearm and the upper arm crosspieces. Both sets of system data were then analyzed by the
same software to derive the x, y, and z translation trajectories of the end effector,
wrist, elbow, and shoulder, and trajectories for the wrist flexion/extension, wrist
radial/ulnar deviation, forearm pronation/supination, elbow flexion/extension, upper arm
X-axis, upper arm Y-axis, upper arm Z-axis, and shoulder medial/lateral rotation angles.
As explained above, the nature of data required different calculations on the
It may be concluded that the electromagnetic tracker and video
motion analysis systems perform closely enough on static inanimate objects to allow
quantitative data to be compared, and permit dynamic inanimate objects to be compared
qualitatively. The systems present no problems for the static animate case, and can be
used interchangeably. Qualitative comparisons can be made in the dynamic animate case, and
for studies interested in basic trajectory shapes and displacements the two systems are
demonstrably comparable.
The authors wish to thank Dr. Gideon Ariel for his extensive technical
assistance in adapting the Ariel Performance Analysis System for this study. This work was
supported by NASA contracts NAS9-18514 and NAS9-18915.
]Go to Top of Document[
REFERENCES
Industrial
Ergonomics and Safety II, Taylor & Francis, pp. 301-308, 1990. Advances in 2. Tyson, J.N., and Das, B., A comparative analysis of anthropometric
and kinematic measurement systems. In (B. Das, ed.),
1. Ayoub, M.M., Human movement
recording for biomechanical analysis. Int. J. Prod Res. 10(l):35-51, 1972.
Biology Society, 13-17,
1985. Medicine and Engineering in of the IEEE Annual
Conference Proceedings of the Seventh 3. Logan, S.E., Vannier, M.W., Bresina, S.J., and Weeks, P.M., Wrist
kinematic analysis using a 6 degree of freedom digitizer.
11. Maulucci, R.A., Optimal Workspace Design. Technical Report, National Aeronautics and
Space Administration, Contract NAS9-18514, Lyndon B. Johnson Space Center, Houston, TX,
1993.
88-91,
1986.Design News
10. Bak, D.J., Electromagnetic monitoring quantifies motion behavior.
9. Diener, H.-C., Bacher, M., Guschlbauer, B., Thomas, C., and Dichgans, J., The
coordination of posture and voluntary movement in patients with herniparesis. J. Neurol.
240:161-167, 1993.
11:55-60,
1992.Med. Biol. Eng. IEEE
8. Bravo, 0., Angular levers and power in the human body.
4:73-79, 1989.Biomech.
7. Pearcy, M.J., and Hindle, R.J., New method for the non-invasive three dimensional
measurement of human back movement. Clin.
-81,
Paper #88-0211, 1988.Proceedings 75
6. Logan, S.E., Groszewski, P., Krieg, J.C., and Vannier, M., Upper extremity kinematics
assessment using four coupled six degree of freedom sensors. ISA
1(7):613-620, 1988.Biomech. 2
5. An, K.-N., Jacobsen, M.C., Berglund, L.J., and Chao, E.Y.S., Application of a magnetic
tracking device to kinesiologic studies. I
4. Bresina, S.J.,
Vannier, M.W., Logan, S.E., and Weeks, P.M., Three-dimensional wrist imaging: Evaluation
of functional and pathologic anatomy by computer.Chn. Plast. Surg. 13(3):389-405, 1986.
12. Maulucci, R.A_ Nonstandard Functional Limb Trajectories. Technical
Report, National Aeronautics and Space Administration, Contract NAS9-18915, Lyndon B.
Johnson Space Center, Houston, TX, 1995.
ng. 2(3):147-157, 1994. Rehab. ETransact. IEEE
13. Eckhouse, R.H., Leonard, E.L., Zhuang, Q., and Maulucci, R.A.,
Improving reaching in preschool children with cerebral palsy through regulated feedback.
tat. 29:209- 211, 1958.Math. S
19. Olkin, I., and Pratt, J.W., Unbiased estimation of certain correlation coefficients.
Amer.
Clinical Erperiments, John
Wiley and Sons, New York, 1986.of Analysis The Design and
18. Fleiss, J.L.,
19(2):147- 166, 1987.Behav.
17. Fetters, L., and Todd, J., Quantitative assessment of infant reaching movements. J.
Motor
ng. 28(5):411-416, 1981.Biomed. ETransact IEEE
16. Sherif, M.H., Gregor, R.J., and Lyman, J., Effects of load on myoelectric signals: the
ARIMA representation.
15. Flanagan, J.R., and Rao, A.K., Trajectory adaptation to a nonlinear visuornotor
transformation: evidence of motion planning in visually perceived space. J. Neurophysiol,
74(5):2174-2178, 1995.
14. Isenberg, C., and
Conrad, B., Kinematic properties of slow arm movements in Parkinson's disease. J. Neurol.
241:323-330, 1994.
]Go to Top of Document[
[Back to Home Page]